Teachers Bring Anti-Racism to the Classroom
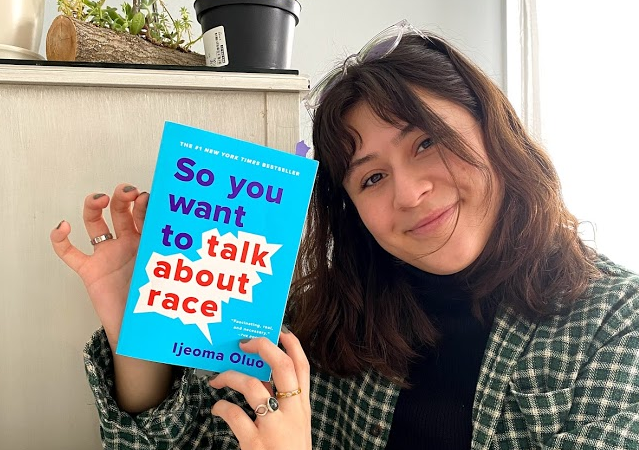
AP Microeconomics student Julia Torres holding assigned reading So You Want to Talk About Race
February 26, 2021
After Black Lives Matter protests put a national spotlight on racial injustice and systemic racism, Northside teachers have incorporated anti-racism lessons and discussions into their classes. From AP Microeconomics to AP Statistics, Mr. David Golden and Ms. Jill Sullivan are redefining how teachers can integrate current events into their curriculums.
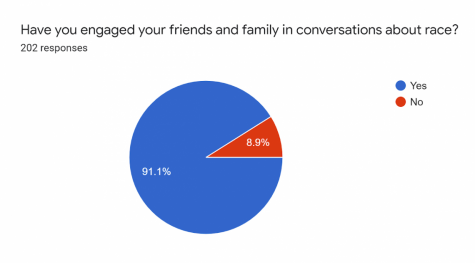
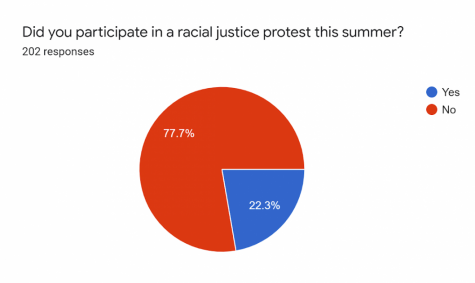
According to a recent poll, 91.1% of Northside students have engaged their family and friends in conversations about race, and 22.3% participated in a racial justice protest last summer.
In response to the murders of George Floyd and Breonna Taylor, AP Microeconomics teacher Mr. Golden led a class discussion with his students last year about how racial discrimination affects economic outcomes and creates wealth inequality. He also spent the past summer collaborating with other economics teachers to create a curriculum that addresses how racial discrimination impacts economic framework and theory.

“Every year when I ask students what topics they wish we spent more time focusing on, students always wish we spent more time focusing on economic inequality and discrimination in the US,” said Mr. Golden. Economic inequality is a topic covered in the AP Microeconomics curriculum. However, it only focuses on statistical tools used by economists, not how that inequality affects real people.
In the beginning of this school year, Mr. Golden assigned the first chapter of So You Want to Talk About Race by Ijeoma Oluo to his AP Microeconomics class. “The author does a great job providing students with the tools necessary to… explore how racial discrimination is felt in the economy and learn how young people can challenge these constructs,” said Mr. Golden. That chapter focuses on how race is intertwined with many other aspects of society.
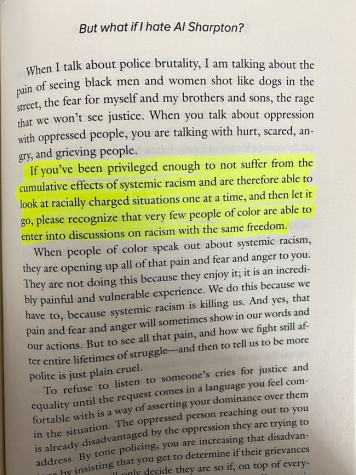
“A lot of people might be going into the class thinking race can’t be connected to subjects like economics. It is important to make sure our perspective is intersectional,” said AP Microeconomics student Julia Torres (Adv. 103). “Reading So You Want to Talk About Race set a nice tone for the rest of the unit. I actually read the entire book afterwards.”
Students were also tasked with choosing from a database of articles relating race and economic theory to another concept such as education or housing. Once placed into breakout rooms, students discussed how those outside concepts related to race and economic theory and created a presentation about their topic. Each group presented to another group and talked with Mr. Golden afterwards.
“In the feedback from my students, many felt these readings and discussions were important as it allowed them to more deeply consider how race and economics are closely integrated,” said Mr. Golden.
Mr. Golden plans on exploring race and gender discrimination in the workforce in a unit later this year. “I always want my students to understand how economic concepts and policies are seen and felt in reality,” he said.
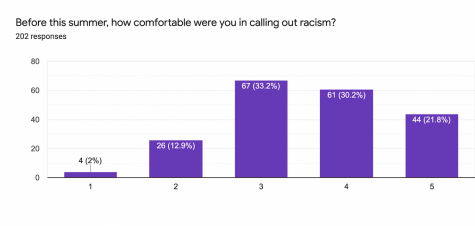
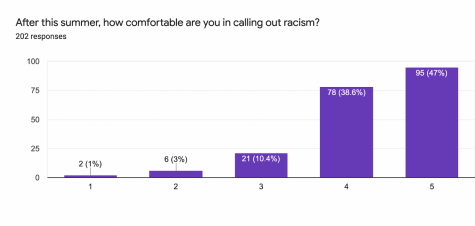
The events of last summer have been described as a reckoning with race in America. A similar trend can be seen in the Northside student body in how they respond to racism in their everyday lives. Before this summer, 52% of students reported being comfortable or very comfortable with calling out racism. After this summer, 85.6% of students reported being comfortable or very comfortable with calling out racism.
AP Statistics teacher Ms. Sullivan has also been using recent events of police brutality to explore data interpretation and application. “I love to incorporate current events, but it can be challenging to do so due to our AP schedule,” said Ms. Sullivan.
Ms. Sullivan found a Desmos activity from Skew The Script, a teacher-led organization that seeks to “make math what it already is: relevant.” She believes it is important to consider data when thinking critically about an issue.
The lesson defined the stop-and-frisk policy in New York City and gave students an opportunity to share what they already knew about the program. Students were given data involving police use of force and race to determine for themselves if there is a relationship between the two variables.
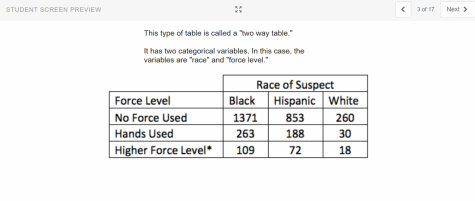
“I saw this lesson and how relevant and timely it was, so it seemed like an obvious choice,” said Ms. Sullivan.
AP Statistics terms like marginal and conditional distribution were incorporated into the questions allowing students to learn new vocabulary. “There is so much data to support bias, and I think looking at the data has the potential to change hearts and minds,” said Ms. Sullivan.
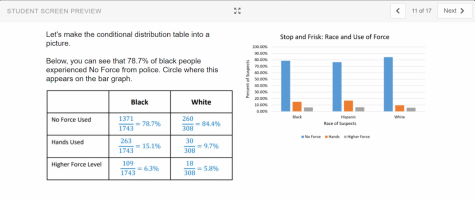
Towards the end of the lesson, students created segmented bar graphs to analyze the percentages of police level of force in relation to race of suspects. The last slide of the Desmos activity gave students a section to reflect on what they had learned and the conclusion reached.
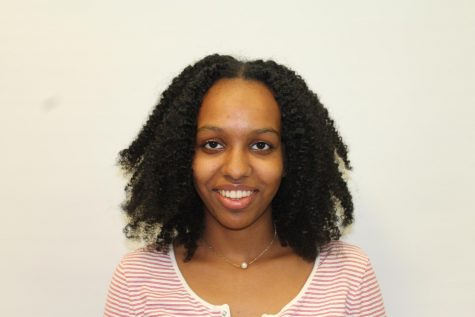
“School should adequately prepare and inform us for the real world which can’t happen unless we actually discuss and expose ourselves to very real problems and issues.” said AP Statistics student Zainab Kazmi (Adv. 105). “By learning about how we can conquer our own biases first, we can then go ahead and tackle larger issues of bigotry and racism.”

